
Navigating Fixed Income Beyond Safety
For decades, bonds were seen as the safest corner of investing for steady income, stable value, and protection when markets turned rough. But that comfort was shaken during the COVID-19 crisis, when yields swung wildly and even government bonds lost value.
What was meant to be a safe harbor suddenly felt like the open sea. The episode reminded investors that bonds are not risk-free; they simply carry a different kind of risk. Understanding where that risk comes from is the first step toward navigating fixed income with true clarity.
How Long Will Your Bond Journey Last?
If the bond market were an ocean, maturity would tell you how far you plan to sail. A one-year government bill keeps you close to shore, the waters are calm, the journey is short, and you can return to port quickly. A thirty-year bond, on the other hand, sends you deep into open seas, where conditions can shift with every wave of inflation, growth, and policy change.
Maturity simply measures how long until a bond repays its principal. But time alone doesn’t tell you how smooth the ride will be. That’s where duration comes in. Duration measures how sensitive a bond’s price is to changes in interest rates. The longer the duration, the more the boat rocks when the tides move.
A 2-year bond may drift only slightly when rates rise, while a 10-year bond can swing sharply with every policy shift even if both are issued by the same government. In short, maturity defines distance, duration defines turbulence.
Understanding both helps investors see beyond the calendar and focus on what truly drives returns. Because in fixed income, it’s not just when you reach your destination,it’s how much the journey moves along the way.
Yet what causes these waves in the first place? To understand why bond prices rise or fall, we must look at the force that moves the tides, the policy rate, the central tool that shapes every bond’s behavior in the market.
Policy Rates: The Bridge Between Economy and Bond
Interest rates are the invisible hand that steers the bond market. When central banks adjust their policy rate, the short-term rate that anchors borrowing costs, every layer of the fixed-income market reacts. A rate hike may appear as a technical decision, but it reshapes the value of every bond already in circulation.
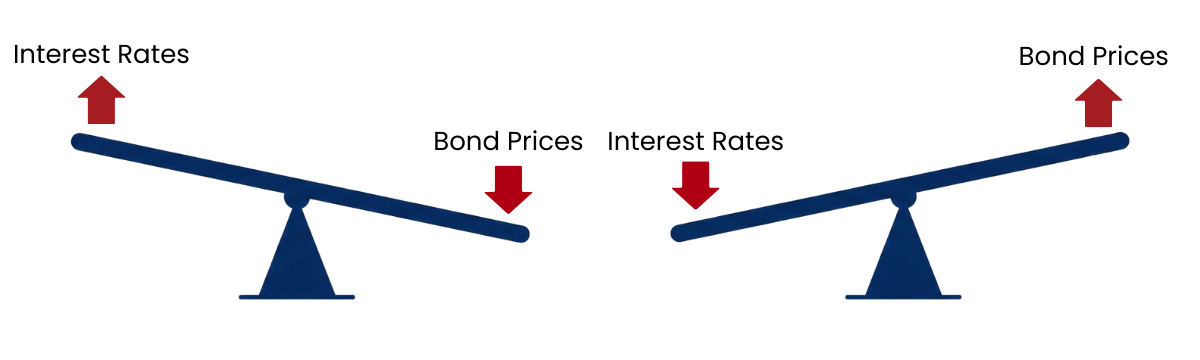
The chart above illustrates the fundamental principle of bond investing: when interest rates rise, bond prices fall — and when rates fall, bond prices climb. This inverse relationship exists because newly issued bonds adjust to the new rate environment. Older bonds, which pay lower coupons, must trade at a discount to remain competitive.
For example, imagine you hold a government bond paying 3% annually. If new bonds are now issued at 4%, investors will demand a lower price for yours to match the higher yield elsewhere. Conversely, if policy rates fall to 2%, your bond becomes more valuable because it offers a better return than the market.
Beyond short-term rate changes, bond yields also reflect what investors expect about the future, especially inflation. When inflation expectations rise, investors demand higher yields to protect their purchasing power, which pushes bond prices lower. In this way, central-bank policy becomes the link between economic conditions and market performance: every change in inflation or growth ripples through yields and prices alike.
The Real Scoreboard: What You Actually Take Home
In the end, what matters to investors is not price or yield in isolation, but total return, the combination of income earned and the change in market value. A bond can provide steady coupon payments yet still leave the investor with losses if prices drop enough. Conversely, a well-timed fall in interest rates can deliver outsized gains, even from a “plain” government bond.
Total return is the lens through which bonds must truly be judged. It shows that bonds are not static, risk-free placeholders but dynamic instruments shaped by central banks, inflation, and market sentiment. For investors, the essence of bond investing comes down to one simple equation:
This is the real measure of what investors take home, combining income and market movement into a single, complete picture of performance.
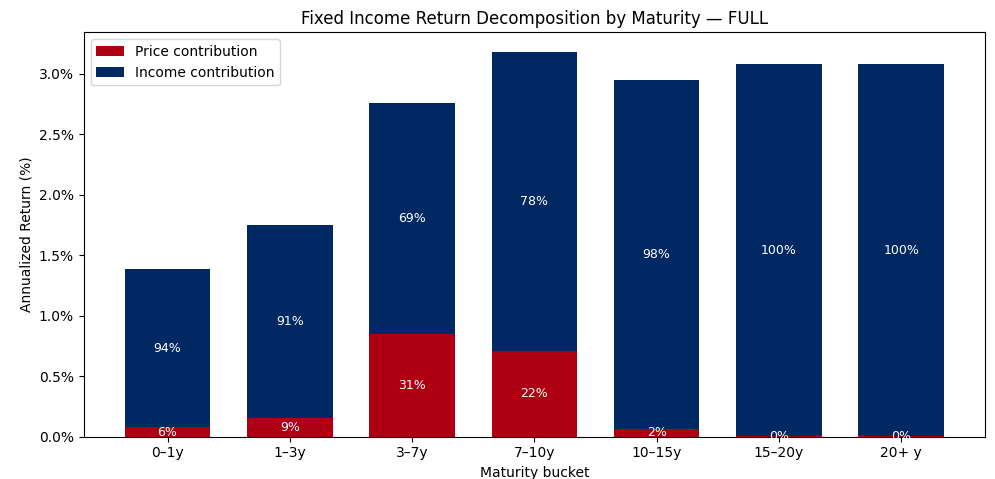
Sources: Yfinance, Metta Associates.
Data from ETFs: SHV, SHY, IEI, IEF, TLH, TLT.
Historical data tells a clear story. Short-term bonds offer calm waters and steady but limited growth. Long-term bonds, stretching 15 to 20 years, lock in predictable income but sacrifice flexibility. Yet somewhere in between lies the most efficient zone: the 5–12 year maturity range. This middle ground captures both the income of long bonds and the price potential of shorter ones.
Beyond 15 years, bonds start to lose their dynamism, their returns come almost entirely from coupons, while price appreciation fades away. In other words, the bond becomes a “set-and-forget” instrument: stable, but no longer a source of balance when markets move. The absence of price response means the bond stops working as a true diversifier. That’s why we taper duration instead of stretching it. By focusing on the middle of the curve, investors stay connected to both worlds. The steady cash flow of income and the potential uplift from market movement. This sweet spot keeps bonds relevant, not as passive holdings, but as active contributors to portfolio performance.
Key Takeaways:
- Bonds Are Dynamic, Not Static Bonds may seem “safe,” but in reality, their prices fluctuate with policy rates, inflation, and labor market conditions. Holding bonds requires understanding both risks and opportunities.
- Maturity is Not Duration Maturity tells you when the bond repays its principal, but duration tells you how volatile the journey will be. They are not the same, and investors must grasp this difference.
- Total Return is What Truly Matters What matters most is not just the coupon or the market price, but the total return that shows what investors actually take home.
Sources: Pimco, McKinsey, Yahoo Finance.
Metta Associates's Strategic Reflection
At Metta Associates, we believe that investing success begins with alignment — ensuring every portfolio decision supports each client’s long-term objectives. Achieving that alignment requires ongoing review and adaptation as markets and client goals evolve.
We continuously monitor market dynamics, interest rates, inflation expectations, and credit conditions, making informed adjustments as the environment shifts. Our approach goes beyond selecting individual bonds; we also assess how fixed income interacts with other asset classes such as equities and commodities. This broader perspective enables us to manage diversification in a truly integrated way, so that every component of a portfolio contributes effectively to overall balance and liquidity.
We maintain bond maturities within the 5–13 year range — a balanced zone that offers neither excessive risk nor excessive safety. As overall market risks decline, we gradually shorten duration to manage volatility while increasing the allocation to fixed income, keeping portfolios both stable and income-generating.
For clients with near-term liquidity needs, we emphasize Thai fixed income exposure to help mitigate currency exchange volatility. Within the broader asset allocation, fixed income serves as a core element for liquidity management and diversification alongside equities and other growth assets — not as a market-timing instrument—always with you.
Disclaimer
The information presented is based on sources believed to be reliable; however, its accuracy or completeness cannot be guaranteed. This material does not represent a forecast and should not be interpreted as a guarantee of future outcomes. It has been prepared with care and objectivity to support long-term, planning-focused financial decisions.